
Summary
- Amazon is a leader in the e-commerce and cloud computing markets, but over the last few years, Amazon's digital advertising business has been gaining speed.
- Amazon's share of the digital advertising market is expected to grow from 8.8% in 2020 to 9.7% in 2021.
- Based on my DCF analysis, I estimate Amazon's fair value of $3,700. This represents roughly 20% upside from the current share price.
- Amazon is a buy for long-term investors.
Investment Thesis
Amazon (AMZN) is an incredibly diverse business, with operations that span many growing markets, including e-commerce, cloud computing, and digital advertising. While Amazon's dominant presence in e-commerce and cloud computing is reason enough to own the stock, I will focus on a third reason: Amazon's growing digital advertising business.
My investment thesis is summarized in the following points:
1. Amazon profits from both the buying and selling of advertising, allowing it to leverage its vast user base and troves of consumer data on both sides of the equation.
2. Amazon's digital advertising revenue is expected to reach $16.7 billion in 2021, giving Amazon an estimated 9.7% market share. This marks an increase from Amazon's 8.8% market share in 2020.
3. Amazon's financials are impressive. Revenue has grown at 28% annually since 2016, but as a result of margin expansion, profits have grown even faster, at 68% annually.
Amazon's Digital Advertising Business
Amazon benefits from both the buying and selling of digital advertising. This can be broken into two categories: Amazon Advertising and Amazon Publisher Services.
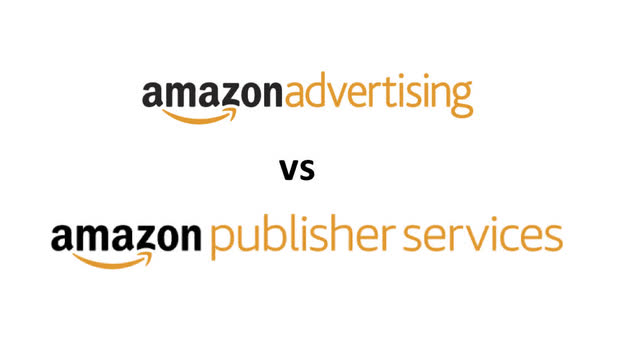 Amazon Advertising
Amazon Advertising is a suite of buy-side tools that help marketers buy ad inventory. This includes ad inventory sold by Amazon, like sponsored product placements on Amazon's marketplace, video ads on FireTV, or display ads on Twitch. It also includes ad inventory sold by Amazon's publisher-partners and third-party exchanges.
This segment includes Amazon's demand-side platform, Amazon DSP, which allows advertisers to programmatically buy ad inventory from Amazon, publisher-partners, and third-party exchanges. If you're not familiar with the term, programmatic advertising is the automated buying and selling of digital ad inventory through real-time bidding.
In the Q1 2020 Advertiser Perception Report, Amazon DSP ranked as the third most used DSP, behind Google (GOOG) and The Trade Desk (TTD).
Amazon Publisher Services
Amazon Publisher Services (APS) is a suite of sell-side tools that help publishers monetize ad inventory. These tools include Amazon's Transparent Ad Marketplace for large publishers, Unified Ad Marketplace for mid-sized publishers, and Shopping Insights (which provides advertisers and publishers with audience segments based on Amazon's first-party consumer data).
APS partners with over 30 other supply-side platforms (SSPs), including AppNexus, OpenX, Facebook (FB) Audience Network, SpotX, Rubicon Project or Magnite (MGNI), and others. This puts publisher ad inventory in front of a large number of ad buyers, increasing bidding competition, which theoretically optimizes publisher revenue.
In the H1 2020 Advertiser Perceptions Report, Amazon Publisher Services ranked second in terms of most used SSP, behind only Google Ad Manager.
 Source: Ad Exchanger.
To summarize, Amazon's buy-side and sell-side tools rank very highly among advertisers and publishers.
Why Choose Amazon?
Marketers choose Amazon Advertising and Amazon DSP because Amazon has an enormous user base and large amounts of consumer data. By knowing which customers made which purchases, Amazon can help marketers put relevant ads in front of consumers, whether or not those marketers actually sell products on Amazon's marketplace. Amazon also provides the tools necessary to measure campaign results and optimize performance.
Publishers choose APS for the same reason. Using Shopping Insights, publishers have access to Amazon's first-party audience segments. For example, publishers can see anonymized snapshots of audience browsing and purchase habits. Using this data, publishers can tweak their content in a way that attracts more visitors. They can also use the data to demonstrate value to marketers looking to target specific audience segments.
The Advantages Of Amazon's Business Model
Amazon's digital ad business is similar to that of other walled gardens, like Google and Facebook. These businesses all own content platforms that are (at least partially) monetized through the sale of ad inventory. These content platforms-Google's search and YouTube, Facebook's social network and Instagram-allow these companies to collect enormous amounts of user data. Leveraging this advantage, all three companies offer sell-side and buy-side tools to help publishers and advertisers, respectively. In other words, they are involved on both sides of the transaction.
This dynamic gives them extraordinary power in the digital advertising space. So much power that these companies can actually push advertisers towards their products. For example, Google Search and YouTube ads can only be purchased using Google's buy-side tools. Similarly, for marketers using Amazon's DSP, Amazon waives its 10% supply fee when ad inventory is purchased through Amazon Publisher Services. These are two different tactics, but the end result is the same: marketers are incentivized to use Google's and Amazon's buy-side tools. This helps Google and Amazon collect even more consumer data, which further perpetuates their advantage.
These business models make it hard to lose. However, investors should be aware that regulatory intervention is possible. All three of these companies have amassed an unprecedented amount of dominance in their respective industries.
Amazon's Market Opportunity
According to eMarketer, the global digital advertising market is expected to grow at 10.4% per year through 2023, to reach $518 billion. This is shown in the graphic below.
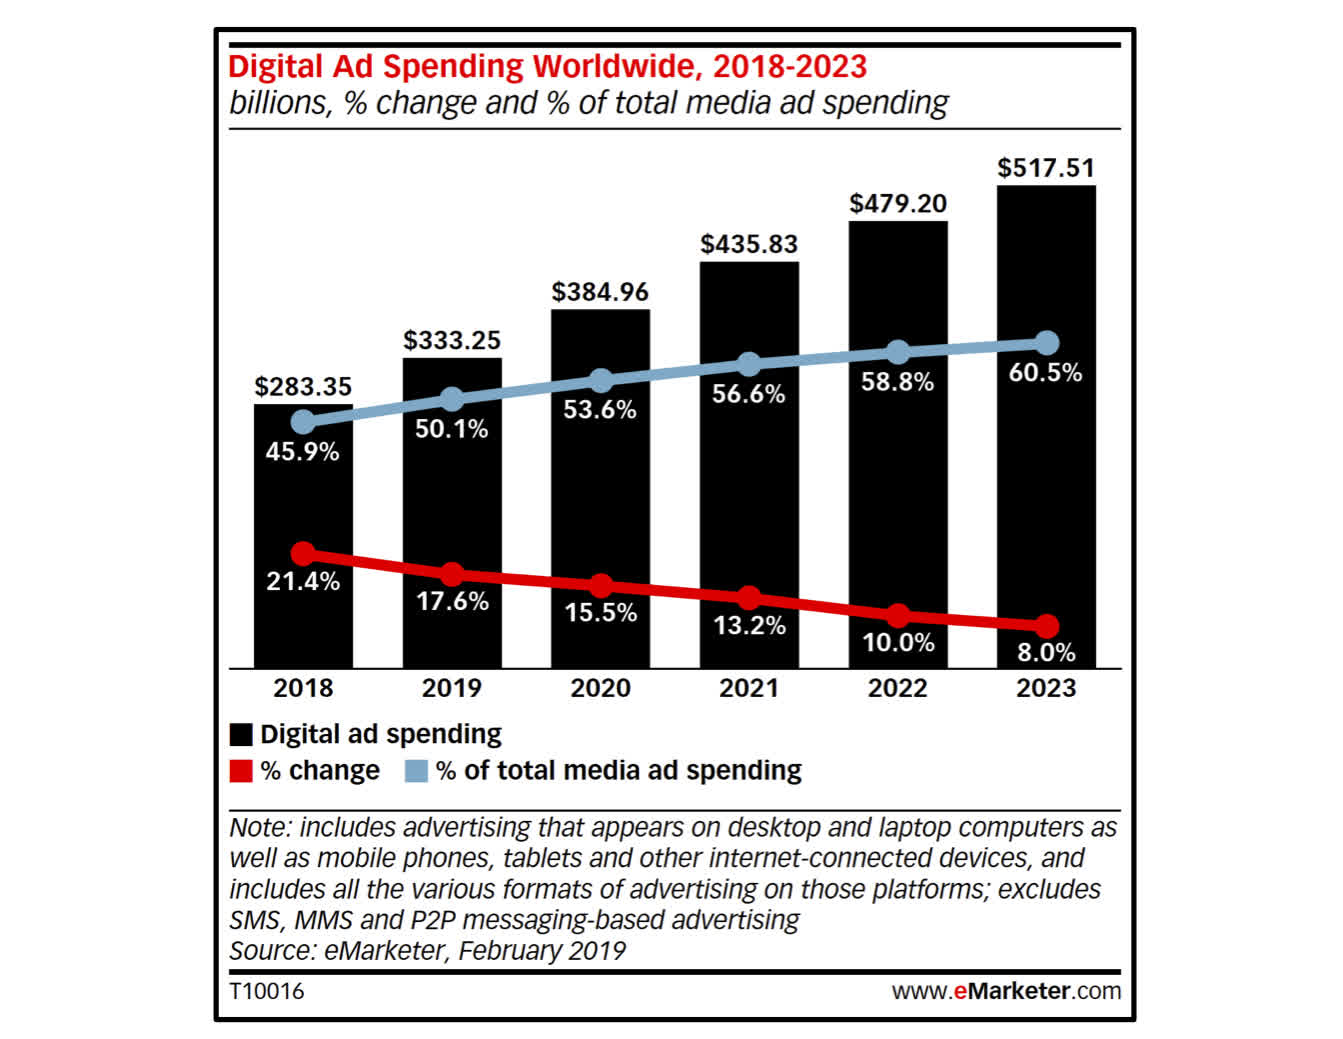 Source: eMarketer.
In United States, specifically, digital advertising spend is expected to reach $129 billion in 2020. In other words, the US alone is responsible for roughly 33% of global digital spend. This is Amazon's primary market opportunity.
By 2021, Amazon will have an estimated 9.7% share of the US digital advertising market. This is shown in the graphic below.
 Source: eMarketer.
As indicated above, Amazon has steadily been taking market share, growing from 6.8% in 2018 to an estimated 9.7% in 2021.
Note that these estimates were made prior to the COVID pandemic, which dramatically impacted digital ad spend throughout virtually every industry in the United States. However, I do not believe this changes my thesis. I believe Amazon will continue to leverage its large user base and vast amounts of consumer data to continue taking market share.
Financial Analysis
I will break this section into two parts. In the first part, I will discuss Amazon's overall financial performance in recent years. In the second part, I will look more closely at Amazon's digital advertising business.
Financial Overview
Since 2016, Amazon has grown revenue by 28% per year. This is shown in the chart below.
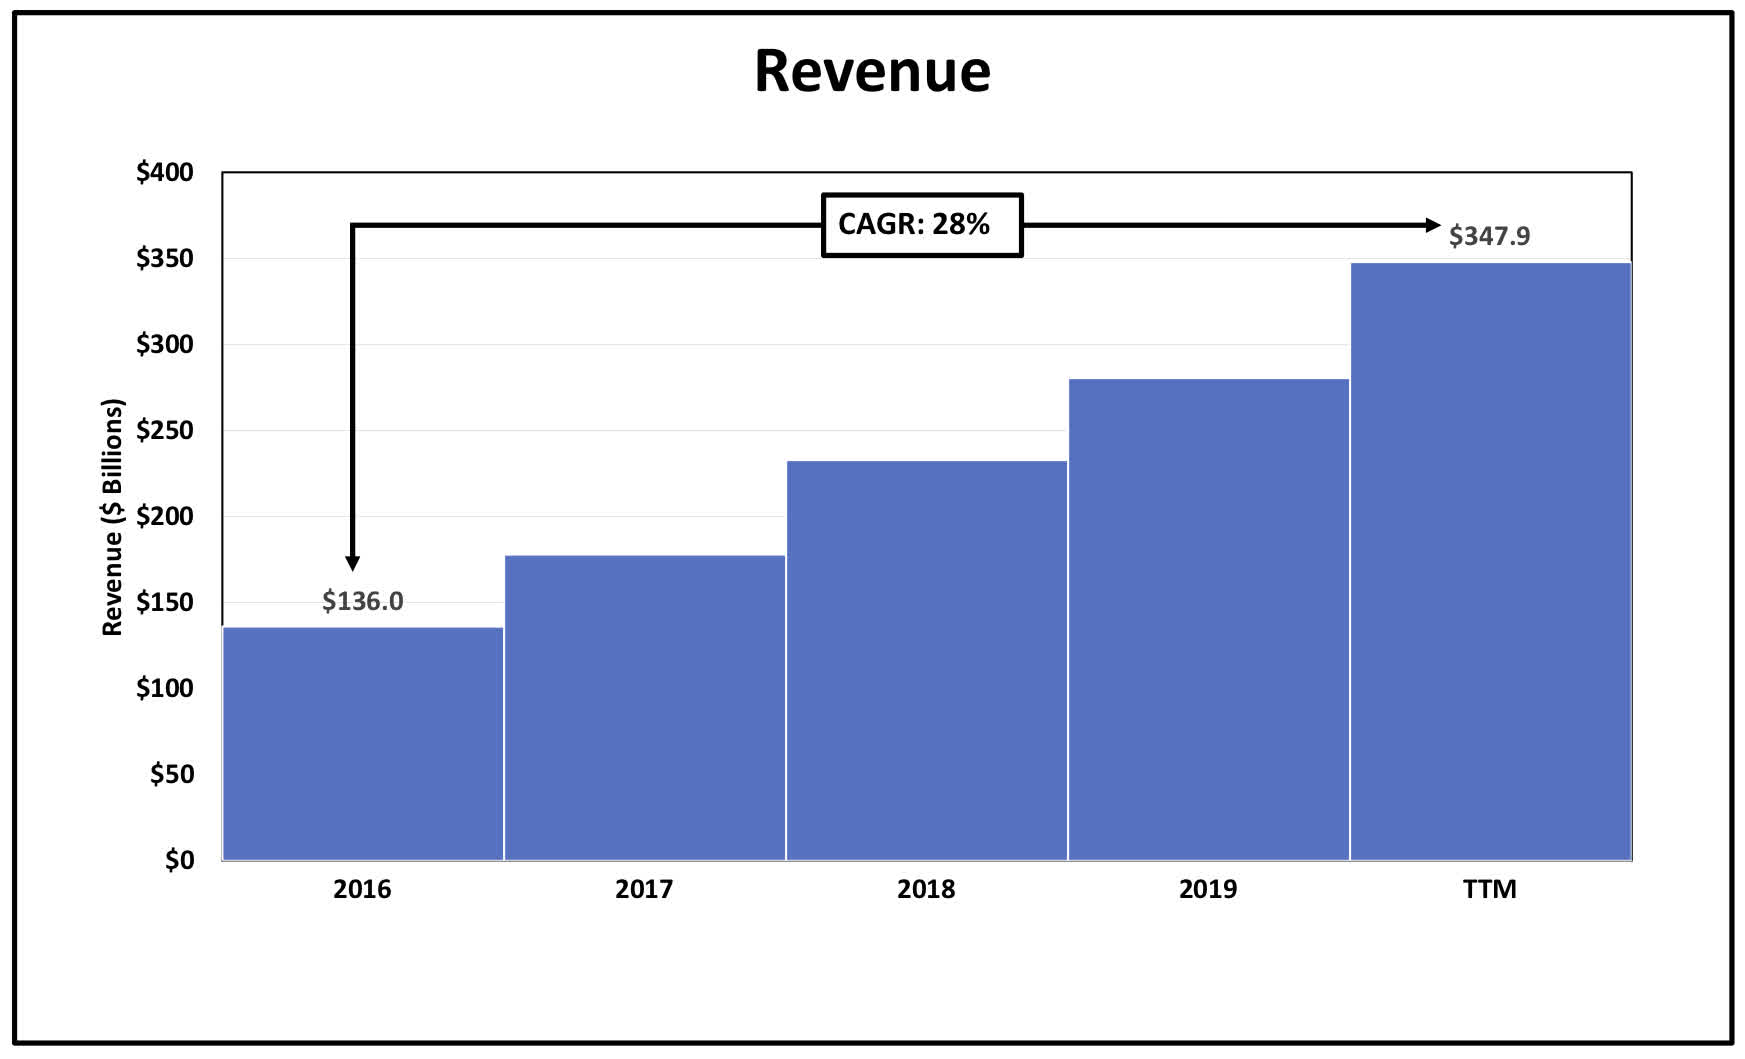
Source: Created by the author using data from Amazon Investor Relations
During this time, operating margins have expanded from 3.1% in 2016 to 5.7% over the trailing twelve months. This margin expansion has primarily been driven by the growth of Amazon Web Services, which represented 9% of total sales in 2016, but now represents over 12% of sales.
As a result of this margin expansion, growth in profits has outpaced growth in revenue. Since 2016, Amazon's earnings per share have increased at 68% per year. This is shown in the chart below.
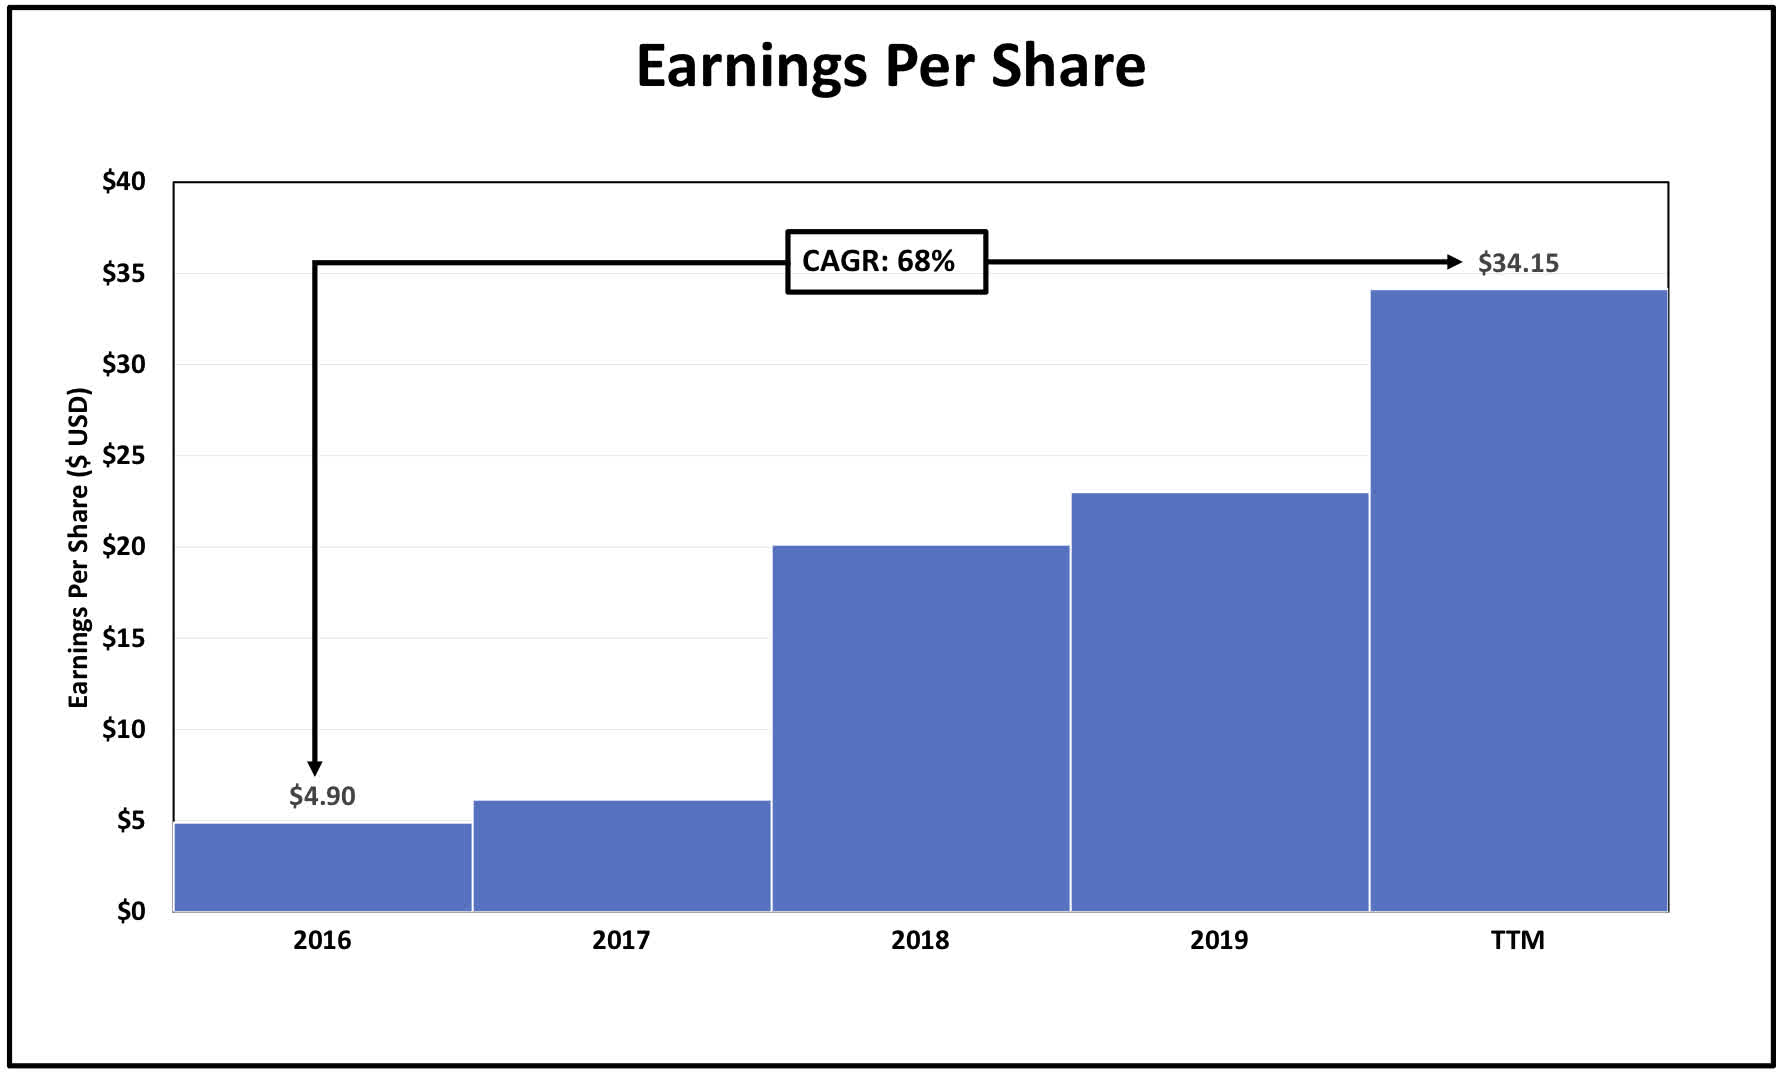
Source: Created by the author using data from Amazon Investor Relations.
Over the same time period, Amazon's free cash flow has grown at 29% per year. This is shown in the chart below.

Source: Created by the author using data from Amazon Investor Relations.
While 29% annualized growth certainly isn't slow, it is significantly slower than earnings growth. The reason for this? Amazon's capital expenditures have grown at 44% per year since 2016, as the company continues to expand its operations, both within current business segments and into new markets.
Financial Analysis Of Amazon's Digital Advertising Business
Amazon doesn't specifically report digital advertising revenue, but rather includes it under "other" sales, along with sales from other services (I.e. the co-branded Amazon Visa credit card). So, investors make do with the "other" sales in order to get a sense for how quickly the Amazon's ad business is growing.
The list below indicates annualized growth rates for each segment of Amazon's business since 2016. Amazon Business Segments and its CAGR
- Online Stores 19%
- Physical Stores -2%*
- Third-Party Seller Services 35%
- Subscriptions Services 41%
- Amazon Web Services 40%
- Other (Advertising, Payments) 63%
Note that Amazon's physical stores largely refer to Whole Foods, which was acquired in mid-2017. The growth rate of -2% referenced above indicates revenue growth from the end of 2017 through the trailing twelve months.
Despite high growth in several segments, growth in Amazon's "other" segment is outpacing the rest of the business. "Other" revenue reached $18.3 billion over the last twelve months, surpassing revenue from physical stores. At this pace, "other" revenue will surpass subscription services in the next two years. If this trajectory continues, I would expect Amazon to begin providing specific details regarding its digital advertising business in the future.
Valuation
In the following discounted cash flow model, I have used the following variables for the following reasons:
Growth Rate: 20.0% - Amazon's FCF per share is $48.46 as of Q3'20. Since 2014, Amazon's FCF per share has grown at 54% annually. This growth has decelerated to 27% since 2016. In order to be conservative, I've assumed 20% annualized growth in FCF per share over the next 10 years.
Terminal Rate: 2.9% - This is a baseline growth figure that corresponds to the average global growth in real GDP between 1999 and 2019.
Discount Rate: 8.0% - This figure represents the rate of return that could be achieved elsewhere (I.e. not Amazon). I've elected to use 8% as it corresponds to the average return of the S&P 500 since 1957, when the S&P 500 was expanded to include 500 stocks.
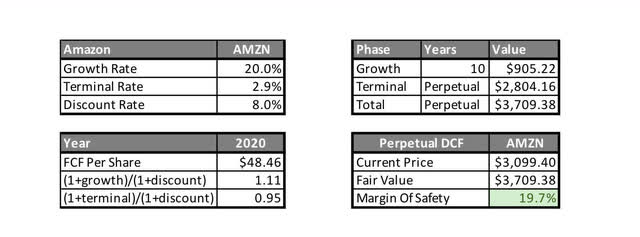
Source: Created by the author.
Using these values, I estimate Amazon's fair value at just over $3,700 per share. This indicates roughly 20% upside at this point.
Note that the outcome of the calculation varies greatly depending on the rate at which Amazon is able to grow free cash flow and the length of time over which Amazon is able to sustain that growth rate. While 20% annualized growth over the next decade is very fast, it seems to be a reasonable estimate given that Amazon has grown FCF per share at 54% annually since 2014.
Now, let's look at the returns investors might expect over the next five years. In the model below, I've assumed Amazon will grow FCF per share at 20% annually over the next five years, then I've selected three different price-to-FCF multiples, all of which represent a discount to today's valuation.
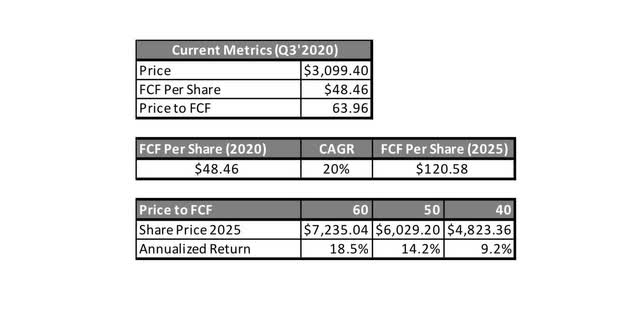
Source: Created by the author.
In the most bullish scenario, at a price-to-FCF multiple of 60, Amazon generates an 18.5% return per year. In the most bearish scenario, at a price-to-FCF multiple of 40, Amazon returns 9.2% per year. Given that the market's average return since 1957 has been roughly 8%, Amazon looks like a market beating investment over the next five years even in the worst case scenario.
As a final note, while a 'worst case scenario' price-to-FCF multiple of 40 might be considered quite high, Amazon's stock has been well above 40 for virtually all of the last five (and even ten) years. This is shown in the graph below.
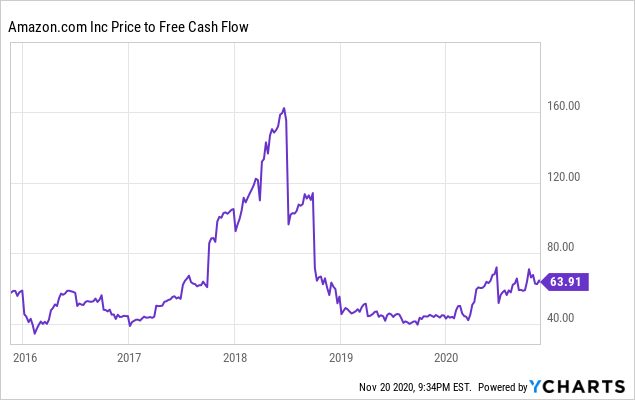 Data by YCharts
Conclusion
Amazon is one of the most valuable companies on the planet, and with good reason. Amazon is already a dominant force in several markets, and it appears Amazon is well on its way to becoming a titan of digital advertising. But even then, I doubt that will be the end of Amazon's expansion. For instance, just this week Amazon announced Amazon Pharmacy. Could Amazon expand more meaningfully into healthcare in the future? Anything is possible.
Amazon has an undeniably rich valuation-with a market cap of over $1.5 billion, the stock trades at 63 times sales and 90 times earnings. But if any company has earned that valuation, it's Amazon. The company has a history of excellent capital allocation, strong execution, and financial performance that is beyond impressive. And I see no reason that won't continue over the coming decade.
For long-term investors, I rate Amazon a buy at $3,100.
Author: Trevor Jennewine


.png)


0 Comments